At our most recent club meeting I made the point that around 75% of the students who assisted on Carnival Day were female and that 80% of the inbound exchange students in 9920 and 9930 were female.
That prompted me to consider just some of the associated changes.
Between the 1930’s through to the 1970’s females made up under 30% of university enrolments. Since the 1980s they have made up more than 50% now trending towards 60%.
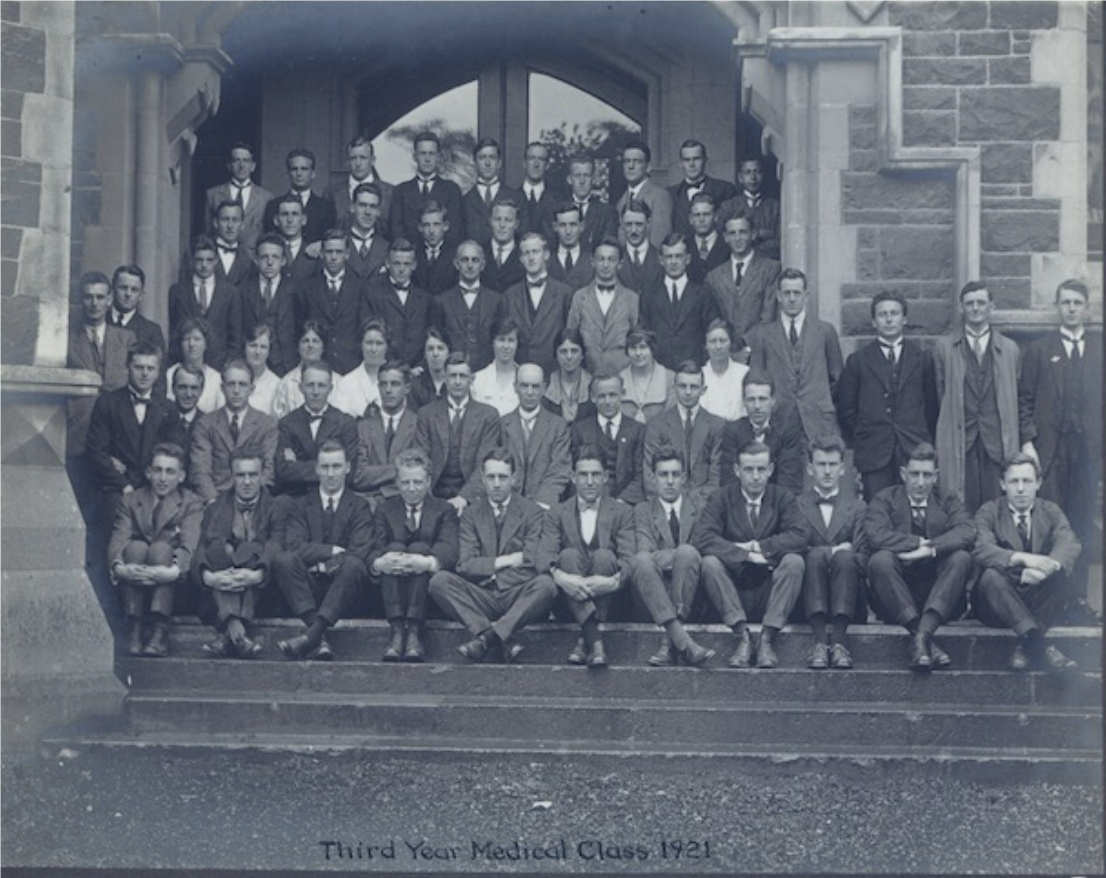
In the 1970s my doctor was female, and she had a photo of her graduation class on the wall. An obvious feature of the photo was that the very marked proportion of the group were male. Fast forward to today. In 2012 60% of registered doctors in New Zealand were male.
By 2023 that was down to 50%. That seems about right you might think? Yes, but when you look at the 2586 doctors who graduated between 2016 and 2020, 59% were female with males now only making up 41% of graduates.
Males still dominate in areas such as engineering but even there the trend is increasingly towards more female participation. In aerospace engineering and technology for example for domestic students in 2024 there were 766 males and 460 females. Women still outnumber men in the “social services” such as nursing, teaching and social work but that is also slowly changing.
Part of the explanation is that since the 1960's female participation in the workplace has increased but another powerful explanation is of course that roles that were once considered the preserve of men can be equally well done by women. In addition schools have actively encouraged girls to choose STEM [science, technology, engineering and mathematics]